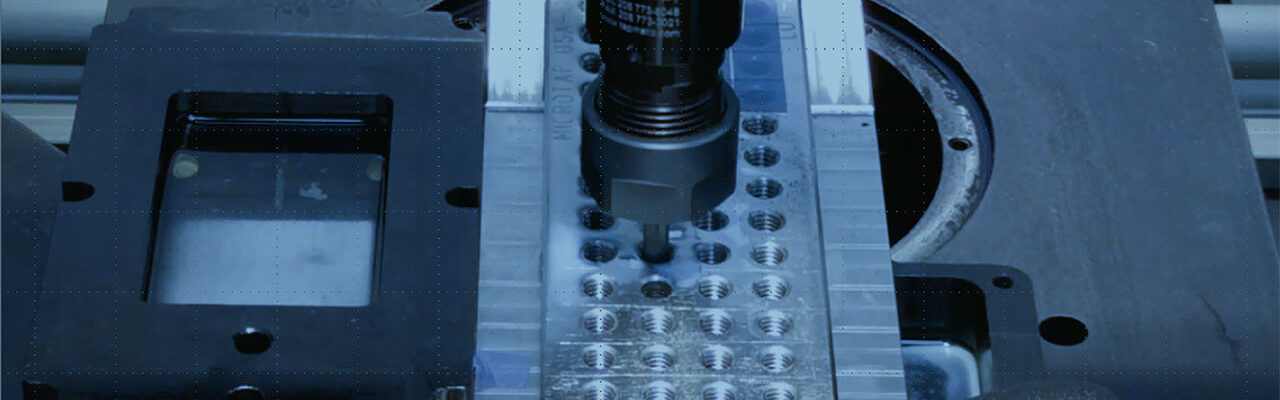
Tapping Torque Tester Overview
- Wide range of standard taps
- In-line Torque and measurement
- Fully automatic multiple tests
- In-line Acoustic sensor to measure failures
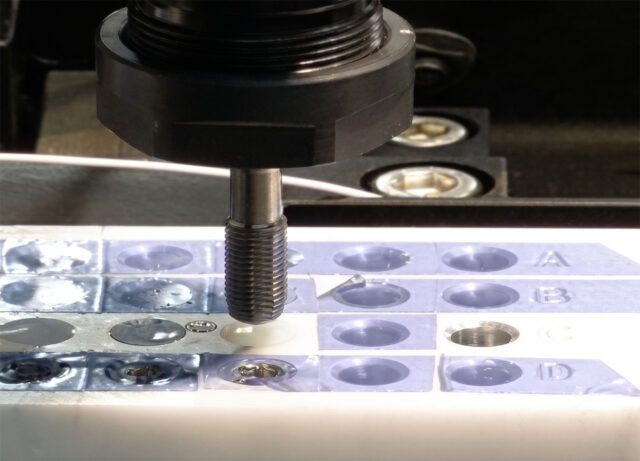
The state-of-the-art Rtec Instruments tapping torque test system allows the study of metalworking fluids, lubricants, taps, and coatings during the cutting, drilling, and forming process. Additionally, the automatic XYZ stage allows the MFT-5000 to move easily to several positions.
Tapping Cycle Torque Analysis
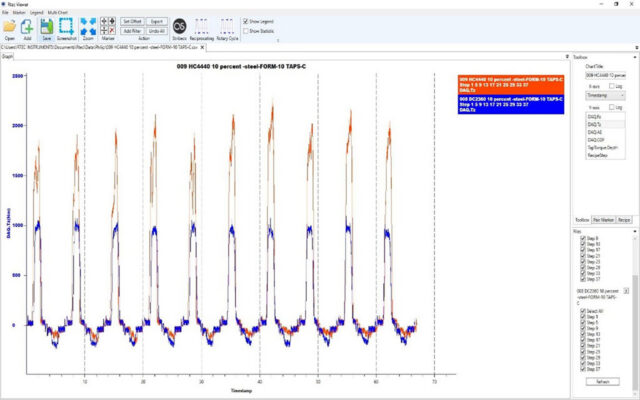
The graph compares the torque measurements of two samples, shown by the orange and blue lines, over multiple tapping cycles. Both samples follow a similar repeating pattern, with sharp peaks followed by a drop before the next cycle. The main difference is that the orange line consistently reaches higher peak values than the blue line, indicating higher torque during the tapping process. The blue line shows lower peak values but follows almost the same trend throughout the test. Overall, both samples behave similarly, but the orange sample demonstrates slightly higher torque performance across the cycles.