Scratch Testing of Automotive Paints Introduction
The JD Power 2017 U.S. Initial Quality Study found that 50% or more of consumer complaints regarding the aspect of cars were associated with scratch, mar, and chip imperfections. Therefore, any improvement to the automotive paints would extend the long-term appearance of cars, reduce warranty claims, and increase the resale value. The improvement of scratch-resistant automotive clear coats has become a high research priority in the automotive industry. This application note shows scratch testing of automotive paints using our Indentation and Scratch Tester, the SMT-5000.
Need help or have a question?
Scratch Test Problematic
Automotive paints are in fact a layering of different materials with both protective and aesthetic goals. The bottom layers must protect the underlying part from corrosion and other damages while the top coat must provide vivid and lasting color along with a consistent and long-lasting shine. The aesthetic top coat system consists of two layers – base coat and clear coat. While the base coat provides color and visual effects, the clear- coat gives the glossy appearance and protects against numerous environmental and mechanical stresses.
Despite the high quality of existing clear coats, there is an increase demand to improve the performances of those materials to resist mechanical damage seen by the cars during their life. To this day, Original equipment manufacturers (OEMs) use simple test methods such as Crockmeter and Amtek-Kistler carwash, to evaluate clear coat resistance to scratches and other mechanical stresses. But as clear coats increase in quality, these tests are unable to distinguish the improvements made to materials because of their large standard deviations and relatively subjective results.
More recently, scratch testing has shown the ability to reproduce real life mechanical damages seen by the automotive clear coats and provide a better differentiator for minor clear coat material improvements. The automotive clear coats are subjected to different types of damage:
- A carwash brush will create small scratches with relatively sharp and small particles. This is often referred to as mar.
- Fingernails and tree branches present a larger size contact and will generate deeper scratches characterized as micro-scratches.
- Keys and shopping carts can create larger and deeper scratches that will sometimes see the removal of the clear coat.
Therefore, clear coat formulators must test their pro- ducts for mar resistance (nano-scratch) along with resistance to micro-scratch and macro-scratch. Rtec Instruments are perfectly fitted for this type of scratch tests, being the only company to provide ex- changeable heads from nano to macro scales with high precision on a single platform.
Figure 1: Range of forces and damages in automotive paints

“Fundamentals and Characterizations of scratch resistance on automotive clearcoats”, Progress in Organic Coatings 125 (2018) 339-347.
Scratch Test Methodology
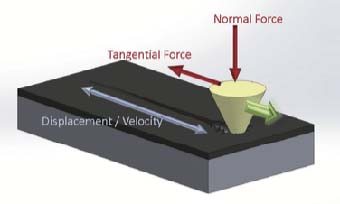
Figure 2: Scratch Testing principle
A scratch is created by dragging a diamond tip of known geometry atop the surface of the sample of interest as shown in Figure 2. As the tip is moved along the surface, the normal load applied to the tip is increased linearly, creating an increase in the severity of the contact.
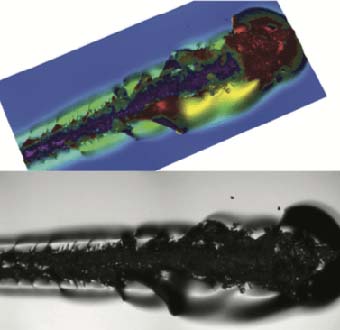
Figure 3: Confocal image of Scratch Failures
The normal forces at which failures happen are called critical loads. Critical loads are found using either imaging or a combination of imaging and signals. Multiple signals can be recorded during the scratch test, allowing the user to correlate behaviors and specific measures.
Scratch Test Conditions
The Indentation and Scratch Tester (SMT-5000) was used to create scratches on a black base coat + 1k clear coat panel.
Three different tips were used to simulate the different types of damages automotive paints can incur in real life. The test parameters are summarized in Table 1.
| Mar Range | Micro Range | Macro Range | |
|---|---|---|---|
| Damage Simulated | Car wash, buffering… | Nails, keys, tree branches… | Shopping cart, belt buckle, coat zipper… |
| Load Application Profile | Linear increasing | Linear increasing | Linear increasing |
| Scratch Length | 2mm | 2mm | 2mm |
| Initial Load | 0 N | 0.1 N | 0.1 N |
| Final Load | 0.5 N | 8 N | 20 N |
| Scratch Speed | 4 mm/min | 4 mm/min | 4 mm/min |
| Stylus | Rockwell 2 µm radius | Rockwell 50 µm radius | Rockwell 200 µm radius |

Figure 2: Paint Panel in testing
Scratch Testing of Automotive Paint Test Results
In all cases the clearcoat present at least 2 types of failure: cohesive failure is the first, followed by tearing or removal of the clearcoat.
The three ranges of forces / damage is presented hereafter.
Mar Testing:
The use of a sharp diamond (2 µm) and small forces (< 1 N) simulates the damage caused by brushes in carwash for example. In this case only one type of failure is observed (cohesive) as shown in Figure 3.
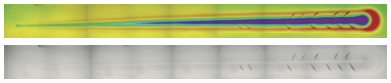
Figure 3: Confocal and bright field images of Mar scratch on automotive paint
Micro Scratch:
A larger radius tip (50 µm) with normal forces in the 10 to 20 N, are used to simulate scratches caused by branches or fingernails on the clear coats. In this case, both cohesive and removal failure can be observed as shown in Figure 4.
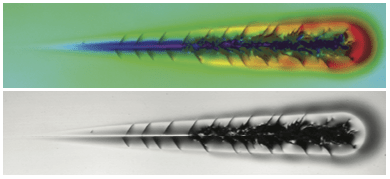
Figure 4: Confocal and bright field images of Micro scratch on automotive paint
Macro Scratch:
The large tip radius (200 µm) along with large normal forces are used to reproduce large scratches sustained by clear coats when scratched aggressively with Keys or the scrapping of a shopping cart.
For these scratches, the removal of clear coat happens relatively quickly after the cohesive failure but also yields deeper damage to the base coat as shown in Figure 5.
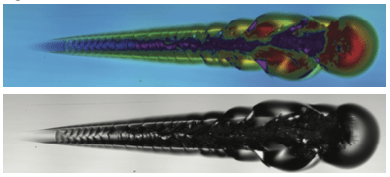
Figure 5: Confocal and bright field images of Macro scratch on automotive paints
This data presents the resulting penetration depth and coefficient of friction for a macro scratch along with the 3 critical loads aligned with the 3D image of the scratch. Each of the critical load is detailed below.

Figure 6: Plots of Penetration depth, Scratch load and coefficient of friction along with Critical loads (vertical lines) for macro scratch on automotive paint
Lc1: First cracks in the clear coat (cohesive)

Figure 7: First failure in macro scratch of automotive paint (Lc1)
Lc2: First signs of removal of the clear coat

Figure 8: Second failure during macro scratch of automotive paint (Lc2)
Lc3: Full removal of the clear coat and damage to underlying base coat

Figure 9: Complete removal of clear coat and damage to base coat in macro scratch of automotive paints (Lc3)
For most clearcoats the change in Coefficient of fric- tion is a great indicator for the first 2 failures (Lc1 & Lc2) which is then confirmed with confocal images locating the first tears (Lc1) and the removal of the clearcoat (Lc2 & Lc3).
Two paint panels were tested to compare two different clearcoats. For each force range, the results of critical loads and scratch depth at Lc are presented in Table 2 and plotted on Figure 12.
| Sample 1 | Lc1 [N] | CD1 [µm] | Lc2 [N] | CD2 [µm] | Lc3 [N] | CD3 [µm] |
|---|---|---|---|---|---|---|
| Mar | 0.19 | 3.17 | ||||
| Micro | 2.63 | 23.60 | 8.7 | 43.63 | ||
| Macro | 2.9 | 12.44 | 6.88 | 33.72 | 13.68 | 61.37 |
| Sample 2 | Lc1 [N] | CD1 [µm] | Lc2 [N] | CD2 [µm] | Lc3 [N] | CD3 [µm] |
|---|---|---|---|---|---|---|
| Mar | 0.28 | 2.48 | ||||
| Micro | 1.84 | 25.02 | 3.53 | 33.80 | ||
| Macro | 2.45 | 16.35 | 7.67 | 33.02 | 15.75 | 61.56 |
Table 2: Critical loads and Critical depths for 2 clearcoat samples
The protective role of clear coat can be summarized by the following plots where the higher critical load and the lower residual depth left in the sample characterizes the best product.
Figure 12 shows the residual depth (at Lc1) vs. the critical load value Lc1 for the three ranges of loads. A trend towards the bottom right corner of the plot will represent superior and improved samples imaging allows for the most advanced understanding of coating / substrate systems behaviors.
Although sample 2 seems better in the Mar range, sample 1 provides better resistance to first tear in the Micro and Macro range. Therefore sample 2 might fare better after a carwash, its performance will be less than sample 1 in the micro and macro ranges. This difference in behavior at different ranges of damage helps the clear coat formulators to improve their products by either increasing their elasticity (reducing the residual scratch depth) and / or increasing the tear resistance for a higher Lc1 at all ranges.

Figure 12: Scratch residual depth vs. critical load for 2 samples in different damage ranges
Conclusions
The scratch testing technique is used here to reproduce different damages experienced by clear coats in real life. With only one instrument, clear coat formulators and OEM users can differentiate between clear coats scratch behaviors by varying tip shapes and normal forces. Scratch Testing provides a new and more accurate technique to detect improvements in clear- coat formulation.
The stresses generated during the scratch test provide information on the strength of the clear coat first, and on the resistance to removal of the clear coat from base coat and underlying coatings. The careful analysis of all signals recorded during a scratch test in addition to the robust imaging provided by confocal and bright field imaging allows for the most advanced under- standing of automotive paint systems behaviors at different scales (mar, micro and macro damages).
International standards
ASTM D7187
“Standard Test Method for Measuring Mechanistic Aspects of Scratch/Mar Behavior of Paint Coatings by Nano-scratching”
ISO 1518
“Paints and varnishes – scratch test”
The Scratch and Indentation Tester Has More To Offer
Learn more about our Indentation and Scratch Tester, the SMT-5000.
Need Versatile Scratch and Indentation Testing?
Take a look at the Multi Function Tribometer, the MFT-5000.
Want to learn more?
Get in touch, and request a demo.
Leading innovation in surface and materials testing instrumentation.
recommended
Information
© Copyright 2021 Rtec-Instruments - All Rights Reserved