Instrumented Indentation Introduction
Since Tabor defined hardness as a contact pressure in his 1951 book, the hardness testers have evolved. They now provide different hardness scales (Brinell, Vickers, Rockwell) for different materials and applications. However, those hardness testers only provide one property: hardness. Furthermore, the miniaturization of electronics forced material scientists to investigate material properties in smaller and smaller samples.
A new technique was proposed in 1992 by George Pharr and Warren Oliver, continuing the work of their advisor Bill Nix. This new technique, called Depth sensing indentation (DSI) or Instrumented Indentation Testing (IIT), provides both indentation hardness and elastic modulus of the material tested. IIT takes the hardness test a step further.
Need help or have a question?
Test Problematic
Engineers are used to getting elastic modulus from a tensile test and hardness from a hardness tester. This works well for most bulk and large sample materials. But the miniaturization of consumer electronics forces the engineers to measure modulus and hardness at a much smaller scale and with much smaller samples. For example, obtaining a 50 micron thick film’s modulus on a product is very complex in a tensile tester, if not impossible.
Most hardness testers rely on the optical observation and measurement of an indent under a microscope. However, this introduces operator error and uncertainty due to the different magnifications available on the microscope. Furthermore, these measures become extremely difficult when the indent is only a few microns across. This explains why the traditional hardness is limited regarding small forces and small material volumes.
Indentation Methodology
Like a hardness test, a diamond tip pushes into the sample with an increasing force (Figure 1). When a maximum force is reached (or maximum displacement), the force is withdrawn to lift the tip off the surface. During both loading and unloading of the surface, the vertical displacement of the tip is recorded.
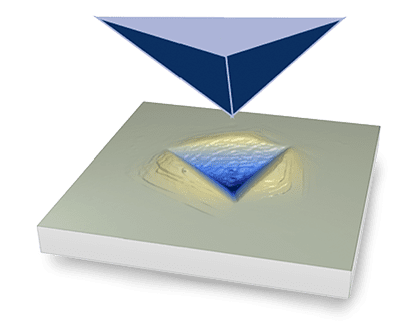
Figure 1: Indentation into a sample
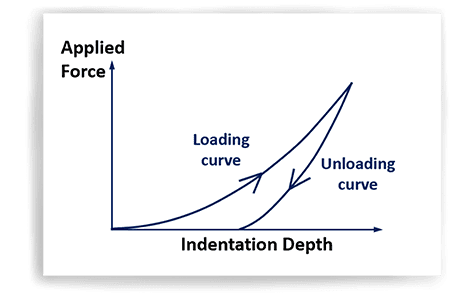
Figure 2: Load vs. Displacement indentation curve
Both force and displacement into the sample are plotted on one graph, as illustrated in Figure 2. These load vs. indentation depth curves are then used to calculate the elastic modulus and hardness of the sample tested.
Test Analysis
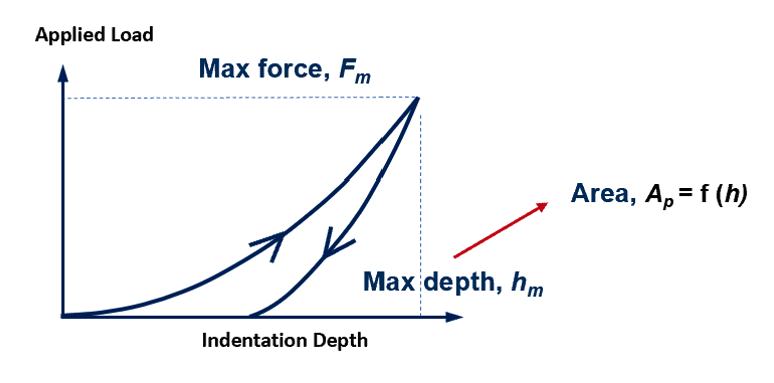
Hardness HIT being a contact pressure, is calculated by dividing the maximum force applied Fm on the sample by the cross-sectional area Ap of the tip at this maximum depth hm. The max force is obtained from the load/displacement curve. Then, the cross-sectional area is calculated using the maximum depth hm reached by the tip and the geometry of the tip used.

Figure 3: Values of load / displacement curve used for Hardness calculations
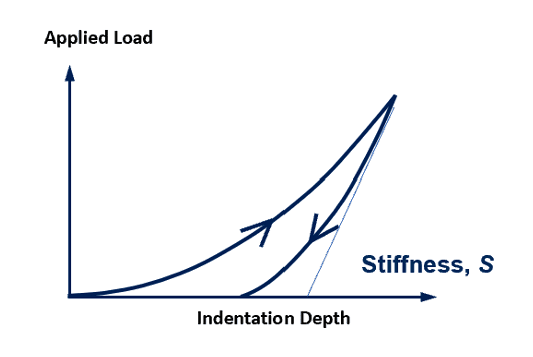
Figure 4: Stiffness measured from load / displacement curve
used for Elastic modulus calculations
During the unloading part of the test, as the tip is withdrawn, the only force on the tip is the elastic response of the sample. Therefore, the unloading curve is representative of the elastic recovery of the material tested. The slope of the unloading curve is extracted and corresponds to the stiffness S of the material. This stiffness is then used in conjunction with the cross-sectional area Ap to calculate the Elastic modulus EIT.
Many other measures can be done on the load-displacement curves and are described in the standards for instrumented indentation ASTM E2546 & ISO 14577.

Instrumented Indentation Test Results
Many different materials can be tested using instrumented indentation. This technique is well proven and provides a straightforward way to get Elastic modulus and hardness for samples that would otherwise be difficult to test in traditional testing equipment.
Indentation of Glasses
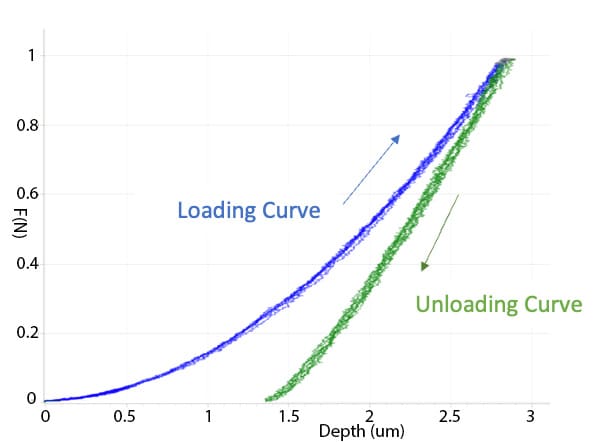
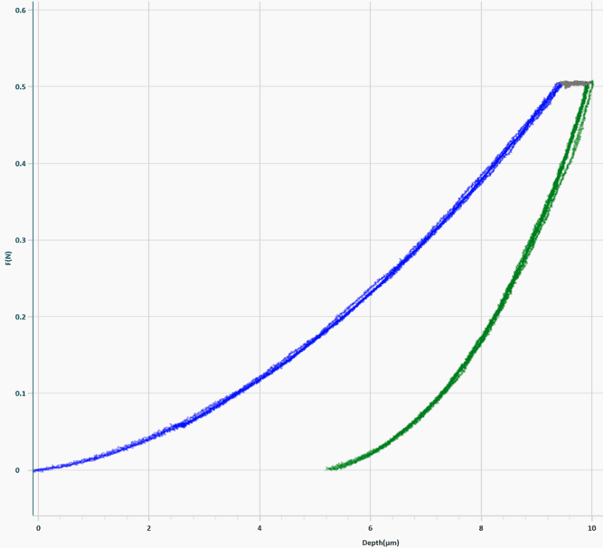
Glasses are often tested for their stability. Figure 5 shows the load displacement curves of 10 indents done to 1 N on a piece of fuse quartz. The results are presented in Table 1.
| Average | Standard Deviation | Standard Deviation % | |
|---|---|---|---|
| HIT (Gpa) | 10.99 | 0.27 | 2.46% |
| Er (Gpa) | 74.67 | 1.15 | 1.54% |
| EIT (Gpa) | 72.68 | 1.19 | 1.64% |
Table 1: Indentation results for Fused quartz
Figure 5: Indentation curves of 10 indents in fused quartz.
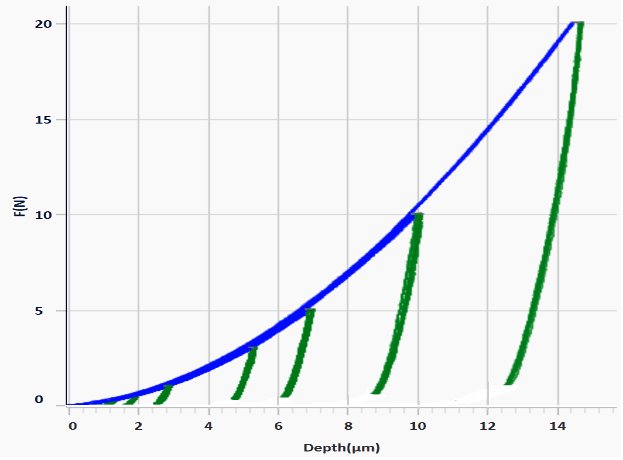
Figure 6: Indentation curves for indents at different loads for steel sample
Indentation of Metals
Metals have a wider range of properties in both the elastic and plastic realms. Figure 6 shows the load-displacement curves for a steel sample tested at different loads to investigate the possible properties change as a function of depth.
Indentation of Polymers
Polymers can also be characterized by indentation as shown in Figure 7 for a PMMA sample tested at 10 different locations.

Figure 7: Indentation from a Vickers tip on PMMA sample
Figure 8: Indentation curves for 10 indents on PMMA sample
Traditional hardness measurements are still required in some situations. Combining the indenter head with the lambda profilometer allows for a full measure of the indentation left in the material. This also allows for calculating hardness on traditional scales such as Vickers, Brinell, and others. Following the indentations, the instrument can automatically acquire the images of each indent for further analysis.
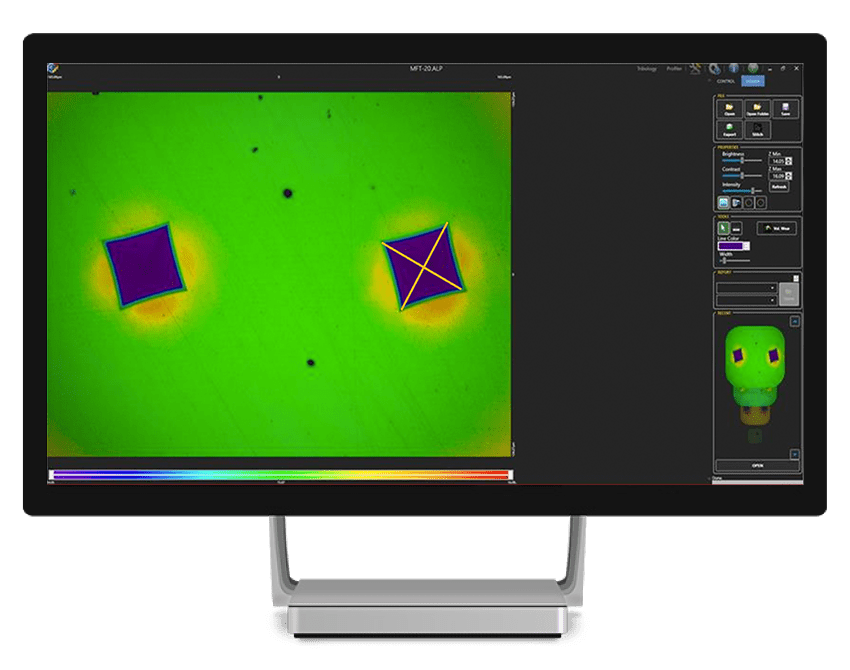
Figure 9: Direct measurements of Vickers hardness in RTEC instruments software using acquired confocal image.
Conclusions
The instrumented indentation is the next step in material characterization at small scales. Born from hardness testing, it takes indentation testing to a new level by providing the elastic modulus and other properties. Compared to its ancestor, the hardness tester, the instrumented indenter provides fully automatic measurement of hardness and modulus with higher precision. As a result, instrumented indentation is the only way to get mechanical properties for small-size samples and complex material systems.
In addition, the indenter and the profiler combination provide unmatched measurement and visualization of indentations.
References
Oliver, W. and Pharr, G. (1992). An improved technique for determining hardness and elastic modulus using load and displacement sensing indentation experiments. Journal of Materials Research, 7(06), pp. 1564–1583.
Oliver, W. and Pharr, G. (2004). Measurement of hardness and elastic modulus by instrumented indentation: Advances in understanding and refinements to methodology. Journal of Materials Research, 19(1), pp. 3–20.
International Standards Office (2015). ISO 14577-1 Metallic materials — Instrumented indentation test for hardness and materials parameters. Geneva: ISO.
ASTM International (2015). ASTM E2546 – 15 Standard Practice for Instrumented Indentation Testing. Conshohocken: ASTM.
The Scratch and Indentation Tester Has More To Offer
Learn more about our Indentation and Scratch Tester, the SMT-5000.
Need Precision Nanoindentation?
Take a look at the PiQ Nanoindenter Tester, the SMT-2000.
Want to learn more?
Get in touch, and request a demo.
recommended
Information
© Copyright 2021 Rtec-Instruments - All Rights Reserved

