Wear Resistance Of Screen Protectors Introduction
Brauchen Sie Hilfe oder haben Sie eine Frage?
Wear Resistance of Screen Protector Test Problematic

Wear Resistance Methodology
Asperity characterization:
The first step was the characterization of the key asperity to pick the right equivalent radius. This was achieved using the Rtec-Instruments Lambda head profilometer to image 3 different teeth of a key and measuring the radii at the different edges (Figure 2).
Wear Measurement:
To simulate the different asperities in contact with the screen protectors, diamond tips of different radii are dragged repeatedly along the surface of the samples to create a wear track following ASTM G133. A constant normal force is applied to the tip to simulate the force of an asperity sliding on the screen protector surface. The full wear track is imaged as constant interval to observe its evolution and quantify the wear as a function of time. The test is stopped when complete chipping failure along the wear track is observed. Multiple signals can be recorded during the scratch test, allowing the user to correlate behaviors and specific measures.
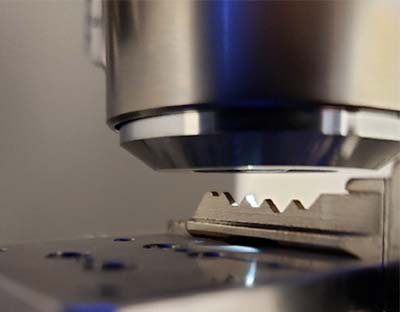
Figure 2: Key Tooth Profilometry
Wear Resistance Testing Conditions
The Indentation Scratch Tester (SMT-5000) was used to create wear tracks (Figure 3) on three different tempered glass screen protectors. A simple reciprocating linear wear test was performed on the different samples. Two different diamonds were used to simulate sand (20 microns radius) and a key (100 microns radius). The normal forces on the diamonds were also chosen to mimic the real-life situations.
A Confocal image of the full track was taken after every 300 cycles. Finally, the wear volume was measured after 1500 cycles to compare the different samples.
The test parameters are summarized in Table 1
| Load Application Profile | Constant Load |
| Track Length | 1 mm |
| Normal Load | 2 & 7 N |
| Linear Reciprocating Frequency | 5 Hz |
| Stylus | Diamond spheres 20 µm & 100 µm radius |

Screen Protector Wear Resistance Test Results
Asperity Radius Characterization
Three teeth of a key were imaged to be representative of different angles and radii. Each tooth was cross sectioned in two orthogonal directions as shown on Figure 4. The average of all radii measured on the key was calculated to be 102.7 microns, yielding the use of a 100 microns radius diamond stylus to perform the wear test.

Figure 4: 3D images of a key tooth and the radii measurements on its cross profiles
Wear Study of Wear Resistance Samples
The number of cycles necessary to observe this complete failure of the screen protector was recorded for each sample and compared to quantify the resistance of each of the products.
The results are shown in Table 3.
Wear Volume (µm3)
| 20 µm stylus | 100 µm stylus | |
|---|---|---|
| A | 2789 | 5116 |
| B | 5674 | 8992 |
| C | 4851 | 6497 |
Table 2: Wear track volume for the different samples

Figure 5: Wear track on Sample A after 300 cycles

Figure 6: Volume Wear
After 1000 cycles, the continuous application of the load in the wear groove starts to create Hertzian cracks in the tempered glass as shown in both confocal and bright field images. The dark field image confirms the presence of crack as indicated on Figure 7.
Starting with the first cracks, some glass particles enter the sliding contact and accelerate the degradation of the groove. Although the apparition of first cracks would incite the user to change its screen protector, this study pushed the linear reciprocating test to the point of chipping the tempered glass to compare the ultimate limit on each sample. Figure 8 shows such failure in the middle of the wear track.

Figure 7: Hertzian cracks on sample B (confocal image on top and bright field at the bottom)
Starting with the first cracks, some glass particles enter the sliding contact and accelerate the degradation of the groove.
Although the apparition of first cracks would incite the user to change its screen protector, this study pushed the linear reciprocating test to the point of chipping the tempered glass to compare the ultimate limit on each sample. Figure 8 shows such failure in the middle of the wear track.
The number of cycles necessary to observe this complete failure of the screen protector was recorded for each sample and compared to quantify the resistance of each of the products.
The results are shown in Table 3.
Figure 9 summarizes this study illustrating both the wear volume and cycle to complete failure for each sample.
# of cycles required for complete failure
| 20 µm stylus | 100 µm stylus | |
|---|---|---|
| A | 3900 | 4500 |
| B | 1800 | 2100 |
| C | 3300 | 3900 |
Table 3: Cycles to complete failure of samples

Figure 8: Chipping failure of the tempered glass on the wear track for sample C

Conclusions
The automatic image acquisition at different intervals provides a unique visualization of the wear track and different failures. The confocal images allow for volume and area calculations therefore simplifying the tribology analysis of such study.
Although those three different screen protectors claimed similar performances, this study showed a clear difference in wear resistance and fracture resistance for these samples.

The Scratch and Indentation Tester Has More To Offer

Need Versatile Scratch and Indentation Testing?
Möchten Sie mehr erfahren?
Kontaktieren Sie uns und fordern Sie eine Demonstration an.
Leading innovation in surface and materials testing instrumentation.
recommended
Information
© Copyright 2021 Rtec-Instruments - All Rights Reserved