Scratch Resistance of Glass Introduction
Since its introduction in 2008, the Corning® Gorilla® glass has been an omnipresent glass in the smartphone’s screens. The introduction of the Victus® version of Gorilla® glass in 2020 shows that the development of such materials is a continuous effort. The development of chemically strengthened glasses became necessary to combined scratch and impact resistance into a thin glass part capable of protecting the smartphones during their intense use. These glasses demonstrate surface strength, ability to contain flaws and scratch resistance. In addition of the consumer electronics that brought them to common knowledge, these products are also used in industrial, automotive, aviation, architectural and pharmaceutical applications.
Brauchen Sie Hilfe oder haben Sie eine Frage?
Scratch Resistance Problematic
The smartphones require a thin glass screen capable of being swiped multiple times and survive being stored with other damaging items such as keys. The glass manufacturers are investing in research that can lead to stronger and more scratch resistant materials to be used by smartphone manufacturers. The quality of a good chemically strengthened glass therefore resides in its ability to resist scratching by particles or items that will come in contact with its surface. The challenge of using a generally brittle material such as glass is that one must increase its elasticity and reduce its brittleness at the same time to achieve the functionality required for its applications. Although scratch testing is an obvious choice to test the scratch resistance of these products, this test can bring researchers much more information than just the scratch resistance. Therefore, scratch testing presents clear advantages for researchers and quality control engineers to improve and control these glass products.
Scratch Resistance Test – Principles of Testing
A scratch is created by dragging a diamond tip of known geometry atop the surface of the sample of interest as shown in Figure 1. As the tip is moved along the surface, the normal load applied to the tip is increased linearly, creating an increase in the severity of the contact. Following the scratch, images are taken of the entire scratch to analyze the different deformation and failures.
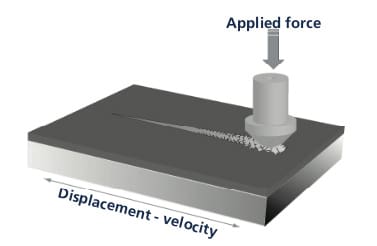
Figure 1: Scratch Testing Principle

Figure 2: Confocal Image of Scratch Failure
The normal loads at which failures happen are called critical loads1, 2. Critical loads are found using either imaging or a combination of imaging and signals (Acoustic emission for example). Multiple signals can be recorded during the scratch test, allowing the user to correlate behaviors and specific measures.
Scratch Test Conditions
The Indentation and Scratch Tester (SMT-5000) was used to create scratches on three different chemically strengthened glasses. This study was done to simulate the possible damage done by sand or hard dust particles on the glass screens. The worst-case scenario was selected as a grain of quartz of 20 microns of diameter3 . Hence the use of a diamond Rockwell with a 20 μm radius. The test parameters are summarized in Table 1.
| Load Application Profile | Linear increasing |
| Scratch Length | 1 mm |
| Initial Load | 50 mN |
| Final Load | 2 N |
| Scratch Speed | 2 mm/min |
| Stylus | Rockwell with 20 µm radius |
Table 1: Test conditions

Figure 3: Glass sample in the instrument

Figure 4: Plots of Penetration depth, friction force, acoustic emission, and critical loads (vertical lines) for glass A sample
Test Results
In all cases, as the normal force increases, the glasses experience at least one type of failure which is identified as cracks on either side of the scratch groove. Two samples further experienced a complete failure of the material with complete fracture and chipping of the material. Figure 2 shows the resulting penetration depth and coefficient of friction for sample B as the normal scratch load is increased up to 2N.
In this case two types of failures are recorded:
Lc1: First cracks on the sides of the groove

Figure 5: Adhesion Failure at the interface
Chipping and complete failure of glass

Figure 6: Chipping of glass A (Lc2)
Confocal and Bright Field imaging of Failure

Figure 7: Confocal and Bright Field images of Glass A in the failures area
The first failure of all samples (Lc1) can be clearly observed on the bright field image at the bottom of Figure 5. The unique image acquisition performed after the scratch records both height and bright field intensity along the entire scratch. This complete acquisition provides additional information pertaining to the failures Lc1 and Lc2 for all glass samples. The combination of confocal and bright field imaging is unique on a scratch tester and provide information never available prior to the use of the Rtec-Instruments SMT-5000. A summary of the critical loads provides a good comparison of the samples as shown in Figure 8.
Scratch Testing Of Glass Conclusions
The three chemically strengthened glasses can be ranked from worst to best: A, B, and C. Although all glasses present a first crack failure observed at the edge of the groove, only A and B chip under 2 N maximum scratch force. Furthermore, all failures look similar on all three samples leading to the conclusion that similar stresses are causing Lc 1 and Lc 2 on all three samples.

Figure 8: Critical loads summary for the 3 glass samples
Conclusions
The scratch testing technique was used to simulate a “worst case” scenario for the wear and damage of chemically strengthened glass such as Gorilla® glass. The stresses generated during the scratch test provide information on the strength of the different glasses and allow for the ranking of the different treatments used to produce those samples. The combination of image and signal analysis provides the most advanced understanding of glass failure behaviors. The same instrument is also used to study wear on those same samples although those results were not reported here.
References
1ASTM C 1624-05 “Standard test method for adhesion strength and mechanical failure modes of ceramic coatings by quantitative single point scratch testing.” 2 ISO 20502 “Determination of adhesion of ceramic coatings by scratch testing.” 3 Erosion and Sediment Control Management System. Lake Macquarie, Australia: 9 September 1999

The Scratch and Indentation Tester Has More To Offer
Learn more about our Indentation and Scratch Tester, the SMT-5000.
Need Versatile Scratch and Indentation Testing?
Take a look at the Multi Function Tribometer, the MFT-5000.
Möchten Sie mehr erfahren?
Kontaktieren Sie uns und fordern Sie eine Demonstration an.
Leading innovation in surface and materials testing instrumentation.
recommended
Information
© Copyright 2021 Rtec-Instruments - All Rights Reserved