Technical Wiki · Surface & Materials Testing
Nanoindentation
A high-resolution technique for measuring hardness, elastic modulus, and time-dependent mechanical behavior at micro- and nanoscale — implemented on Rtec Instruments platforms alongside tribology, mapping, and environmental control.
P_max
h_max
h_f
S = dP/dh
loading
unloading
Depth, h
Load, P
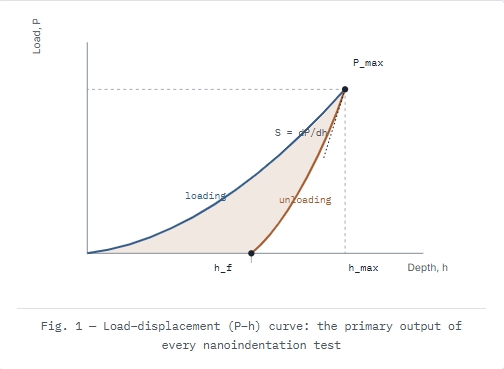
Fig. 1 — Load–displacement (P–h) curve: the primary output of every nanoindentation test
01. Overview
Nanoindentation is an advanced mechanical characterization technique used to measure material
properties at micro- and nanoscales. Within Rtec Instruments systems, nanoindentation provides
high-resolution, quantitative insights into surface and thin-film behavior by precisely controlling
and monitoring force and displacement during indentation.
The technique is particularly valuable for evaluating small volumes of material where traditional
mechanical testing methods are not applicable.
02. Rtec Instruments Nanoindentation Philosophy
Rtec Instruments integrates nanoindentation within a broader multi-functional platform, enabling:
- High-precision force and displacement control
- Seamless integration with tribology (scratch, wear, friction)
- Modular testing configurations
- Automated mapping and high-throughput workflows
- Environmental control (temperature, humidity, optional vacuum systems)
This approach allows users to combine mechanical property measurement with real-world surface performance evaluation.
03. Measurement Fundamentals
3.1 Load–Displacement Curve
The core output of a nanoindentation test is the load–displacement (P–h) curve, which represents
the material response during indentation (see Fig. 1, above).
Key phases
- Loading: elastic + plastic deformation
- Unloading: primarily elastic recovery
Critical parameters extracted
- Maximum load (P_max)
- Maximum depth (h_max)
- Unloading stiffness (S = dP/dh)
3.2 Deformation Mechanisms
Nanoindentation probes localized deformation behavior:
- Elastic deformation — reversible displacement
- Plastic deformation — permanent material flow
- Time-dependent effects — creep and viscoelasticity (in polymers and soft materials)
04. Mechanical Properties Measured
4.1 Hardness (HIT)
Hardness represents resistance to plastic deformation:
where P_max = maximum applied load, A = projected contact area
4.2 Elastic Modulus (EIT)
Elastic modulus is derived using the Oliver–Pharr method, implemented in Rtec Instruments software.
The reduced modulus (E_r) accounts for both indenter and sample properties.
4.3 Additional Properties
Rtec Instruments Capabilities
- Depth-dependent modulus
- Creep behavior
- Viscoelastic properties (storage and loss modulus)
- Fracture and crack initiation (with sharp tips)
- Energy dissipation analysis
05. Instrumentation
5.1 Core Components
Rtec Instruments nanoindentation systems include:
- High-resolution actuator (electromagnetic or piezo-based)
- Precision load sensor
- High-sensitivity displacement sensor (capacitive or interferometric)
- Advanced control and analysis software
5.2 Indenter Geometries
| Geometry | Primary use |
|---|---|
| Berkovich | Standard hardness and modulus measurements |
| Cube corner | Fracture and brittle material studies |
| Spherical | Elastic–plastic transition and contact mechanics |
06. Testing Modes
6.1 Quasi-Static Indentation
Standard load–hold–unload testing used for hardness and modulus extraction.
6.2 Continuous Stiffness Measurement (CSM)
Applies a small oscillation during loading to measure stiffness continuously:
- Modulus vs. depth
- Thin-film characterization
- Gradient materials
6.3 Dynamic Mechanical Analysis (NanoDMA)
Used for viscoelastic materials:
- Storage modulus
- Loss modulus
- Phase angle
6.4 Automated Mapping
Rtec Instruments systems support:
- Grid-based indentation mapping
- Property distribution visualization
- Statistical analysis across surfaces
07. Data Analysis
Rtec Instruments software provides automated and user-controlled analysis tools:
- Contact point detection
- Curve fitting and smoothing
- Area function calibration
- Batch processing and reporting
7.1 Oliver–Pharr Method Workflow
- Identify maximum load (P_max)
- Calculate unloading stiffness (S)
- Determine contact depth (h_c)
- Compute contact area (A)
- Extract hardness and modulus
7.2 Contact Depth
where ε depends on indenter geometry
08. Applications
Nanoindentation in Rtec Instruments systems is widely used in:
09. Advantages of Rtec Instruments Nanoindentation
- High spatial resolution
- Multi-technique integration (mechanics + tribology)
- Automated workflows and mapping
- High repeatability and precision
- Flexible system configuration
10. Limitations and Considerations
- Surface roughness can affect accuracy
- Substrate influence in thin films
- Tip calibration is critical
- Thermal drift must be minimized
- Proper test design is required for soft materials
11. Best Practices
Rtec Instruments Guidelines
- Perform regular tip calibration
- Allow system thermal stabilization before testing
- Keep indentation depth <10% of film thickness
- Use multiple indents for statistical reliability
- Use mapping for heterogeneous samples
- Validate results with complementary techniques when needed
12. Standards and References
- ISOISO 14577 — Instrumented indentation testing
- METHODOliver, W.C. & Pharr, G.M. methodology
13. Notes for Rtec Instruments Users
- Always verify calibration status before measurements
- Use predefined test templates when available
- Document test conditions for reproducibility
- Combine nanoindentation with scratch testing for coatings
- Use dynamic modes for advanced material characterization
Summary
Nanoindentation on Rtec Instruments platforms delivers precise, reliable, and application-driven
mechanical characterization at small scales. Its integration with tribology, automation, and
advanced analysis makes it a powerful tool for both research and industrial environments.